Macroeconomic Theory
Employment
Attendance
Agenda
1
Labor Market Debates
2
Finishing GDP
3
Labor Market Indicators
4
Review and to Do
Labor Market Debates
Review of Apricitas article
In class we discussed the Aprictas article and the implication that the labor market recovery is a big policy success as compared to the slow recovery from 2007
We also discussed the debate over whether the inflation we are experiencing is a tradeoff for employment recovery
Finishing GDP
Nominal vs. real
Nominal GDP Sum of the quantity of final goods produced times their current prices
Real GDP Sum of the quantities of final goods times constant (not current) prices
| Year | Quantity of cars | Price of cars | Nominal GDP | Real GDP (in 2012 dollars) |
|---|---|---|---|---|
| 2011 | 10 | $20,000 | $200,000 | $240,000 |
| 2012 | 12 | $24,000 | $288,000 | $288,000 |
| 2013 | 13 | $26,000 | $338,000 | $312,000 |
Real GDP in 2011 (in 2012 dollars) = 10 cars x $24,000 per car = $240,000
Real GDP in 2012 (in 2012 dollars) = 12 cars x $24,000 per car = $288,000
Real GDP in 2013 (in 2012 dollars) = 13 cars x $24,000 per car = $312,000
Price Index
For more than one good, relative prices of the goods are natural weights for constructed the weighted average of the output of all final goods.
Real GDP in chained (2012) dollars reflects relative prices that change over time.
The year used to construct prices is called the base year.
Practice
| 2012 Quantity | 2012 Price | 2013 Quantity | 2013 Price | |
|---|---|---|---|---|
| Coffee | 40 | $5 | 50 | $7 |
| Shoes | 400 | $100 | 450 | $100 |
| Surgery | 100 | $1000 | 80 | $1500 |
Calculate nominal GDP and real GDP in 2013 using 2012 as a base year.
Practice
| 2012 Quantity | 2012 Price | 2013 Quantity | 2013 Price | |
|---|---|---|---|---|
| Coffee | 40 | $5 | 50 | $7 |
| Shoes | 400 | $100 | 450 | $100 |
| Surgery | 100 | $1000 | 80 | $1500 |
Real 2013 GDP: $125250 and Nominal 2013 GDP: $165,350
Practice
| 2012 Quantity | 2012 Price | 2013 Quantity | 2013 Price | |
|---|---|---|---|---|
| Coffee | 40 | $5 | 50 | $7 |
| Shoes | 400 | $100 | 450 | $100 |
| Surgery | 100 | $1000 | 80 | $1500 |
Real 2013 GDP: $125250 and Nominal 2013 GDP: $165,350
Calculating GDP deflator (price index): \(\frac{\$165,350}{\$125250} = 1.32\)
In base year GDP deflator = 1, so 1.32 indicates prices have risen 32%
GDP symbols
\(Y_t\) will denote real GDP in year t
\(\$Y_t\) will denote nominal GDP in year t
GDP critique and growth
Some exceptions
There are exceptions to the rules of GDP – big ones! - homeowners imputed rent - spending on behalf of consumers - financial services
This reminds us: GDP is a mix of money flows and some guesses at “welfare”
GDP and Life Expectancy
Growth rates
Remember that growth rates are always calculated as:
\(\frac{new-old}{old}\)
Labor Market Measurement
CPS Survey
Caution
Unemployment is not the same as unemployment insurance applicants!
Household measure:
- 60,000 eligible households (110,000 individuals)
- Monthly
- one-fourth of the households in the sample are changed every month
- live interviews conducted either in person or over the phone
Definitions
People with jobs are employed.
People who are jobless, looking for a job, and available for work are unemployed.
The labor force is made up of the employed and the unemployed.
People who are neither employed nor unemployed are not in the labor force.
Alternative measures of labor underutilizaiton
U-1: percentage of labor force with 15 weeks or more of unemployment.
U-2: job losers and people who completed temporary jobs.
U-3: The official unemployment rate
U-4: Includes discouraged workers who have given up on job searching.
U-5: Adds marginally attached workers who want a job but haven’t actively looked recently.
U-6: The broadest measure, incorporating all the above plus those working part-time for economic reasons.
Establishment survey
part of a regular electronic survey (Current Employment Statistics)
contacts about 160,000 businesses and government agencies, which pass on information about 440,000 worksites
establishment survey typically considered more reliable but lacks demographic and other info
Employment indicators
Prime age epop (CPS)
- male and female
Unemployment rate (CPS)
- demographic gaps
Prime age labor force participation (CPS)
Full time prime age employment (CPS)
Nonfarm payroll (CES)
Initial jobless claims (ETA)
Wage indicators
Employment Cost index
Average hourly earnings
Core non-housing services workers index
JOLTS
Quit rate
Layoff rate
Hiring rate
Job openings rate
Beveridge Curve
Illustrates the dynamic relationship between job vacancies and the unemployment rate.
Shows how economic conditions impact the match between job seekers and job openings.
Shifts in the Beveridge Curve can signal changes in the labor market’s health.
Movements along the curve reflect cyclical changes in unemployment and job vacancies.
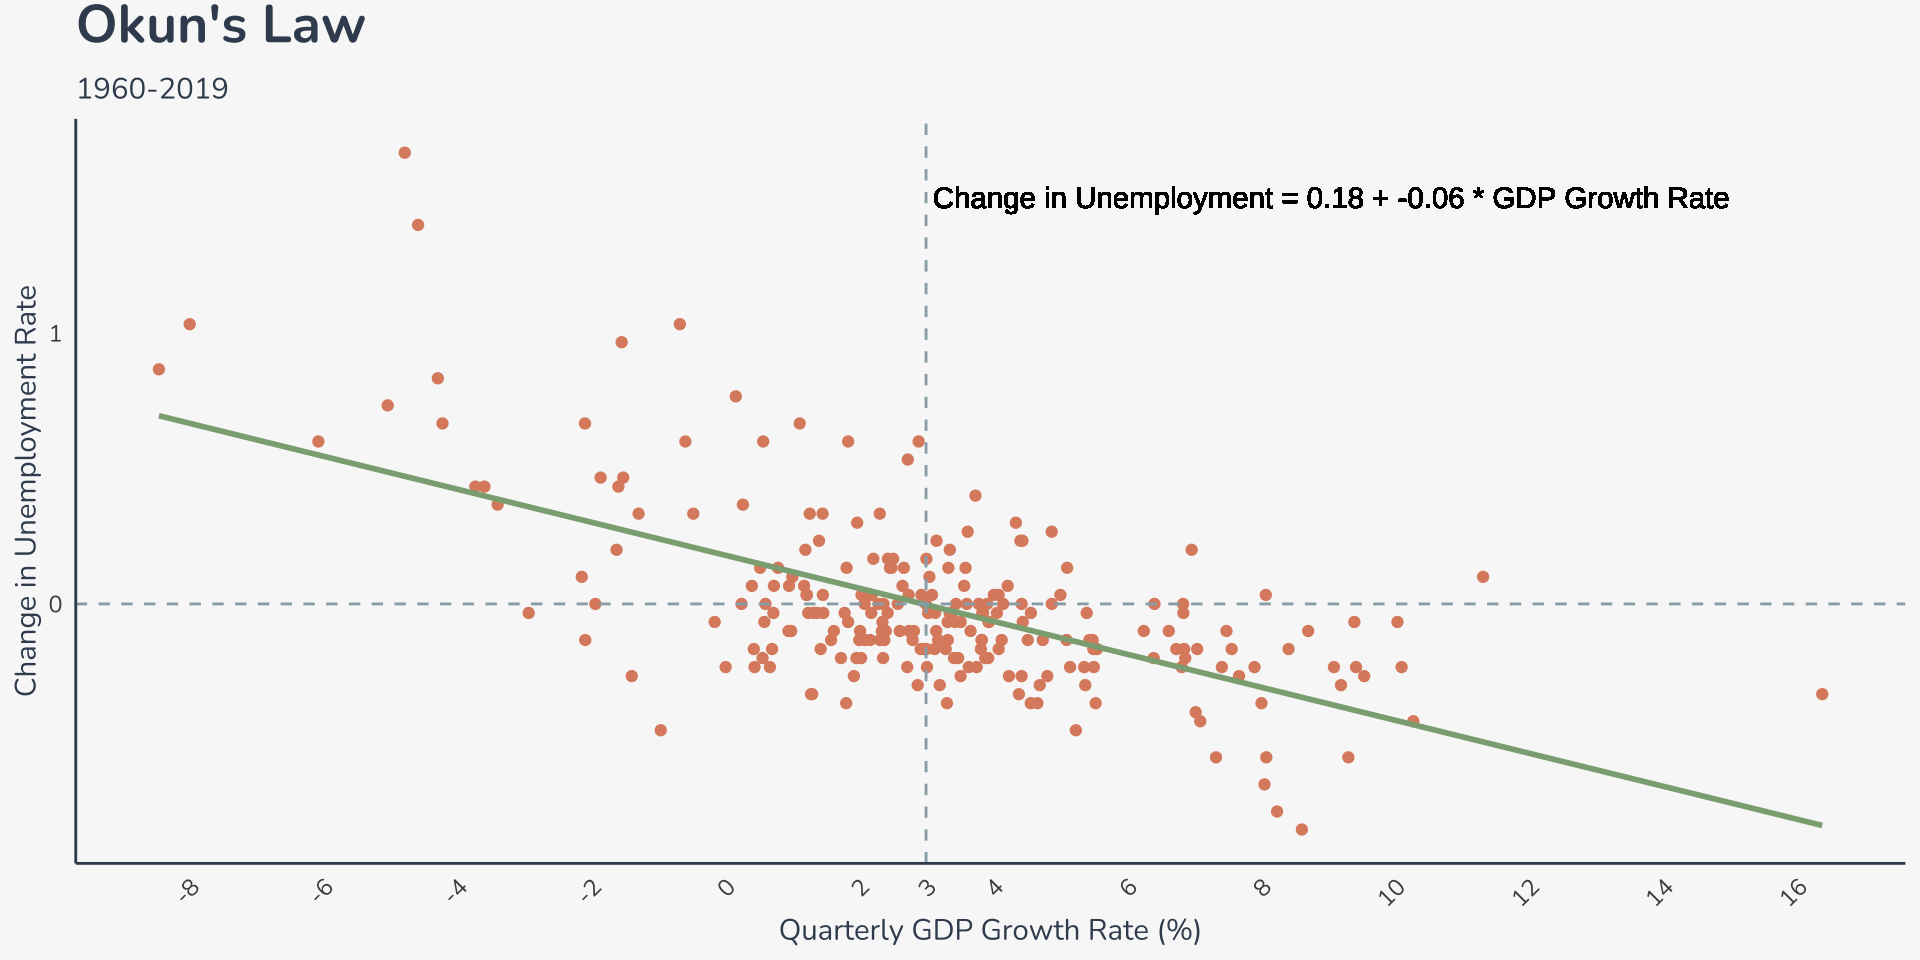
Okun’s Law
Quantifies the empirical relationship between changes in the unemployment rate and real GDP growth.
Reflects the inverse relationship between economic growth and unemployment.
Provides a useful rule of thumb
Review and to do
Review
1
Finishing GDP
2
Labor Market Measures
3
Labor Markets Now
4
Review and to Do