Macroeconomic Theory
Inflation and the Phillips Curve
Agenda
1
Three Inflationary Forces
2
Inflation Expectations
3
The Phillips Curve
Attendance
Three Inflationary Forces
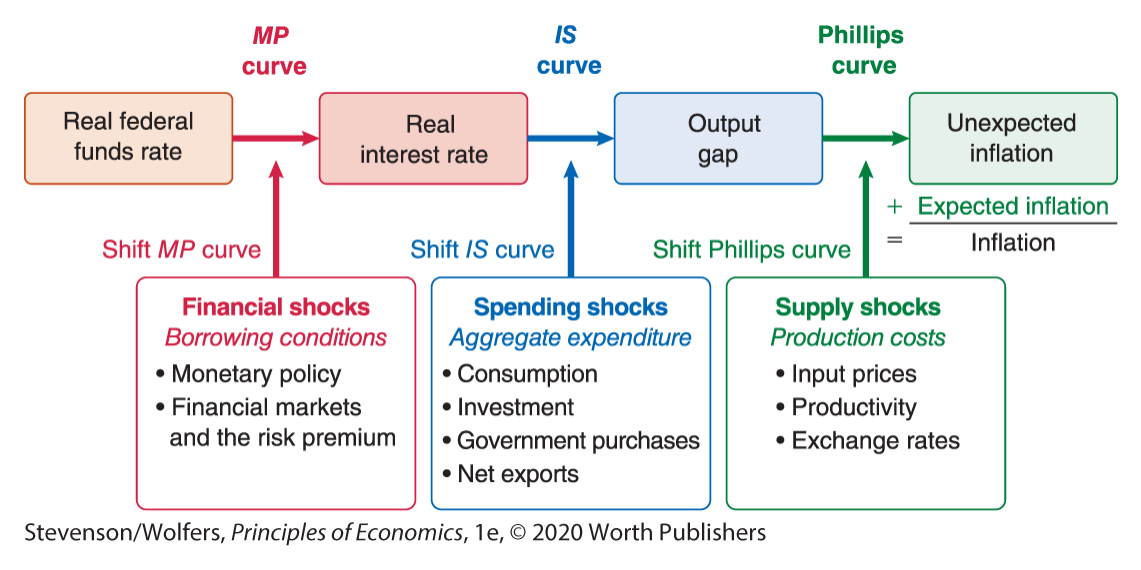
Three causes of inflation
Inflation Expectations: The rate at which average prices are anticipated to rise next year.
Demand-pull inflation: Inflation resulting from excess demand.
Cost-push inflation: Inflation that results from an unexpected rise in production costs.
Total Inflation
Inflation = Expected inflation + Demand-pull inflation + Cost-push inflation
Inflation Expectations
Businesses consider current input costs and competitor prices when setting the prices of their goods and services
They also use information about future prices to set prices for goods and services.
Expectations matter.
Inflation Expectations Create Inflation
If businesses expect prices to rise by 2%, they will increase their prices by 2%, ensuring prices actually rise by at least 2%.
In other words, expectations can become self-fulfilling
Implications for monetary policy
If expectations are a signficant driver of inflation, then one solution might be for the central bank to convince people that inflation will be low
How can they convince people? By taking your inflation targeting goal very seriously.
If people doubt that you will be willing to tackle inflation, expectations of inflation might rise
Measuring Expectations
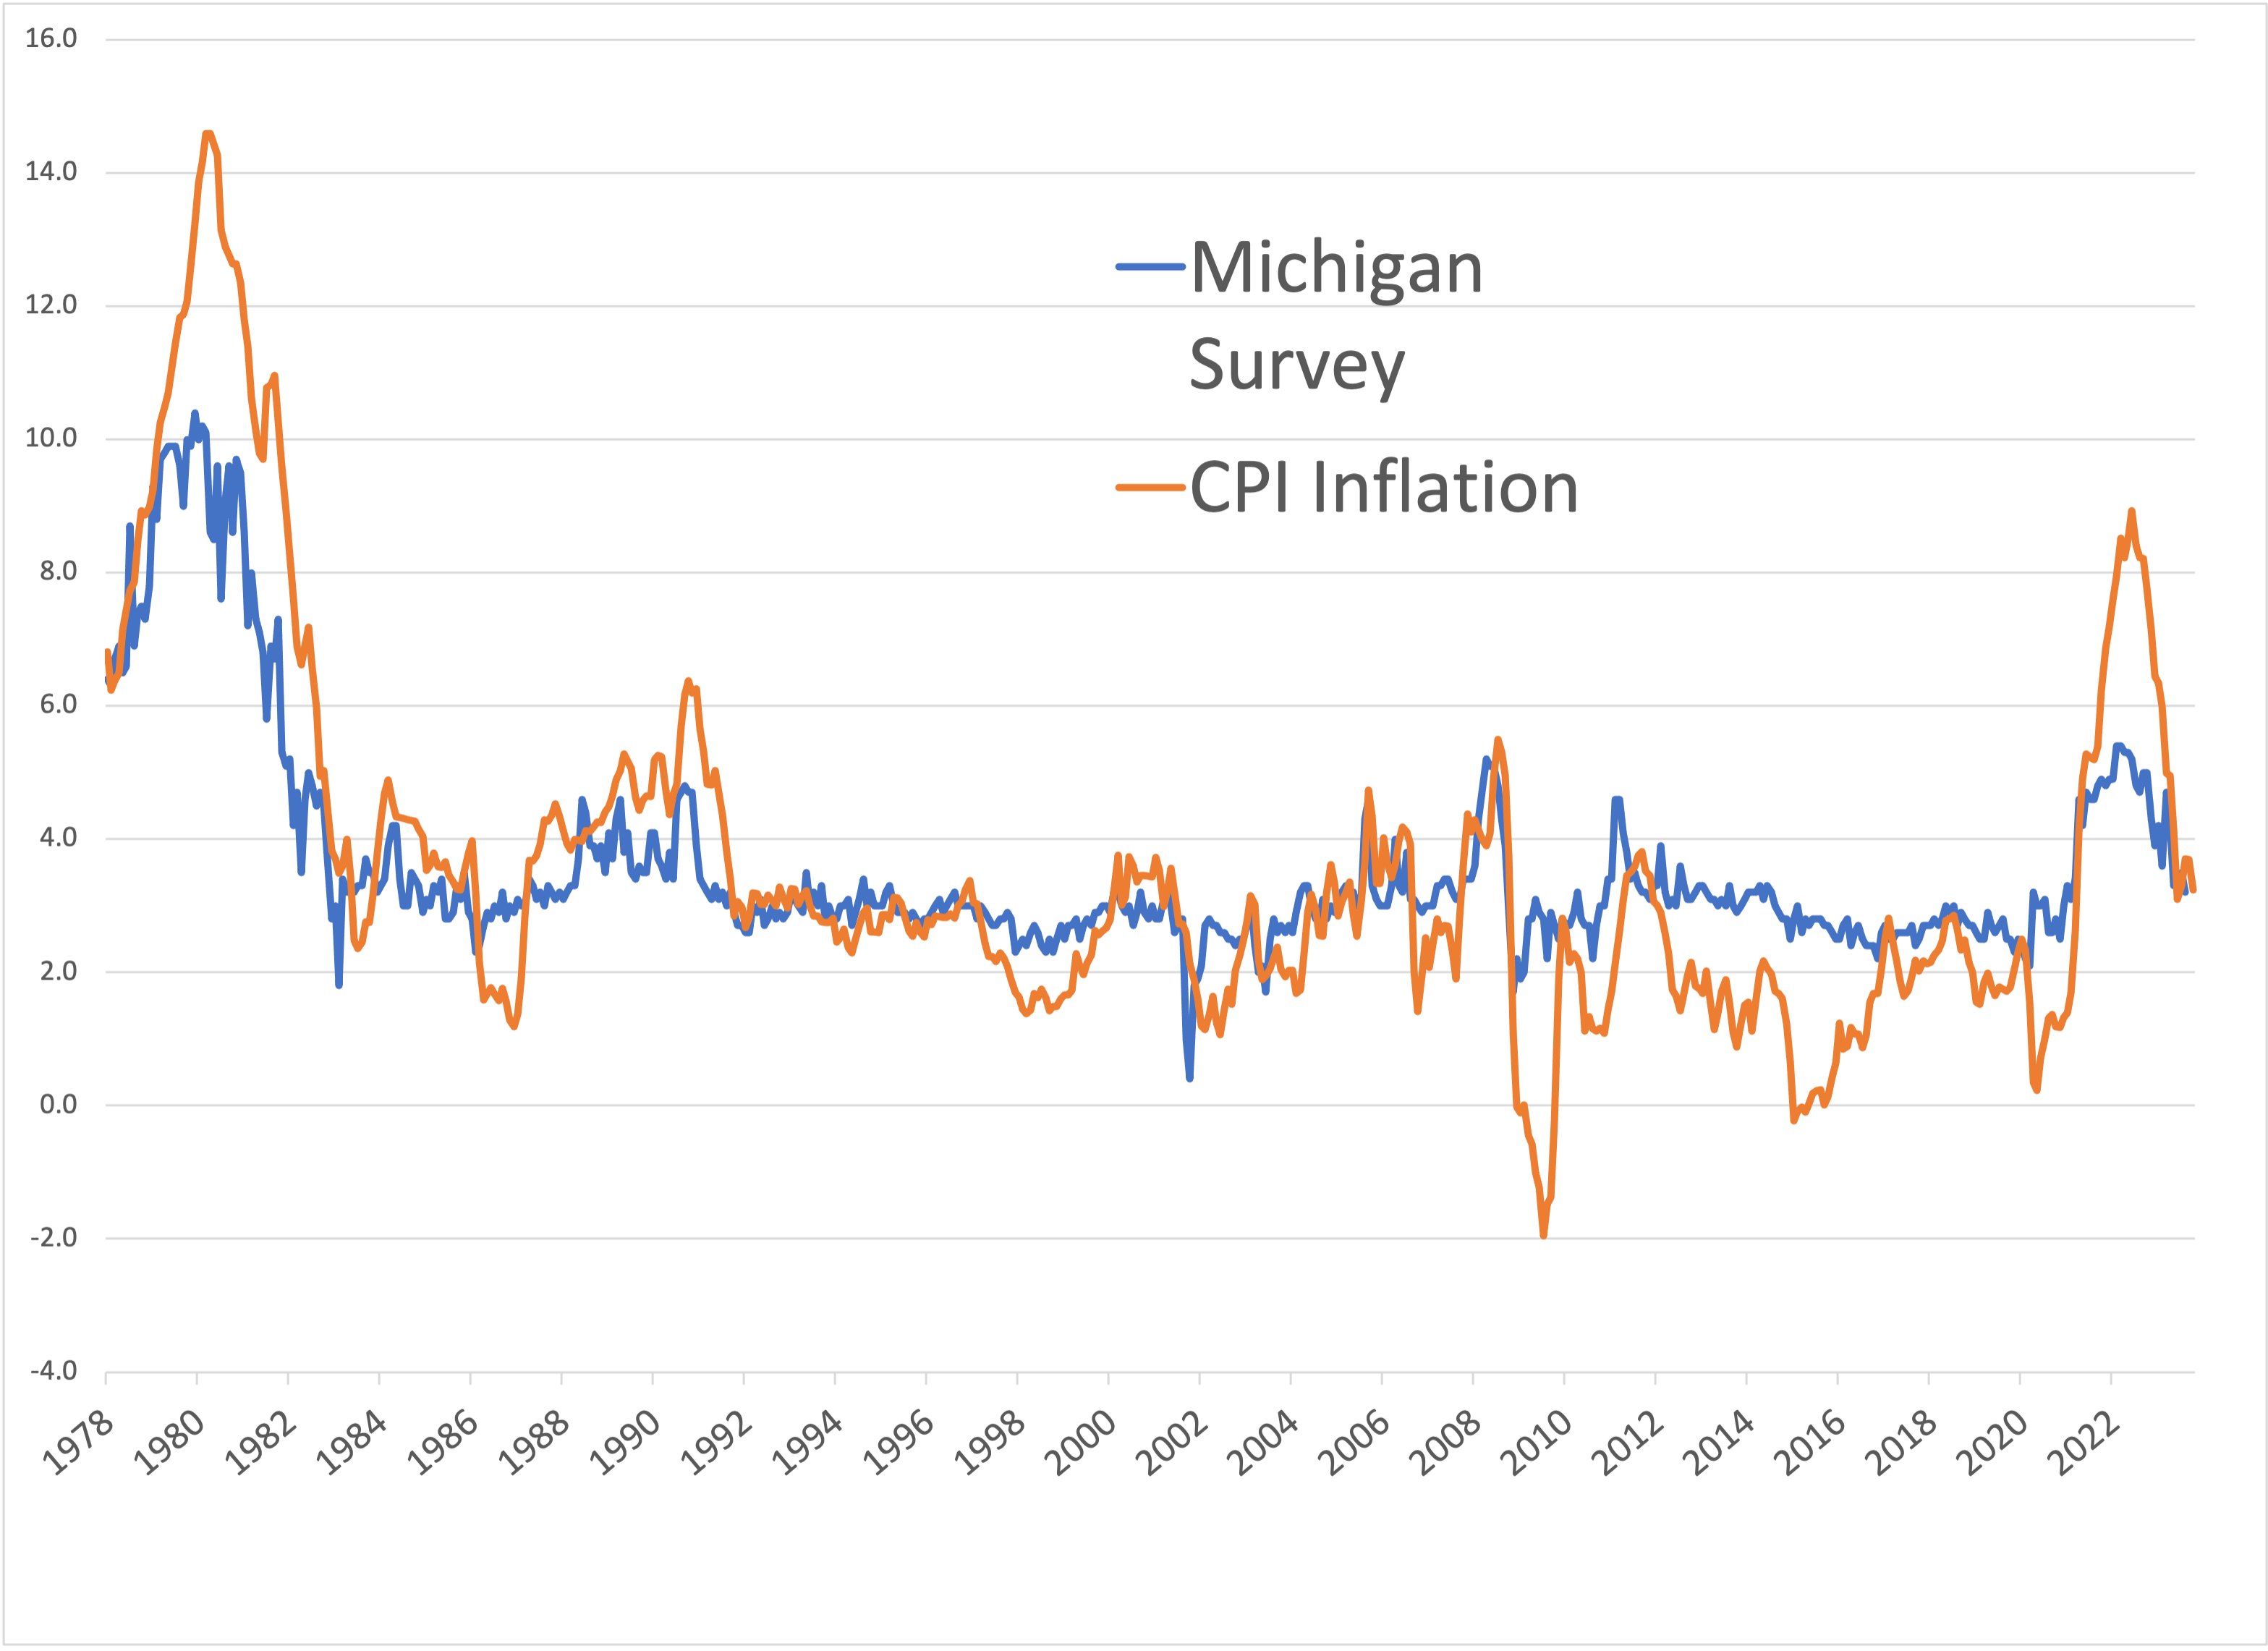
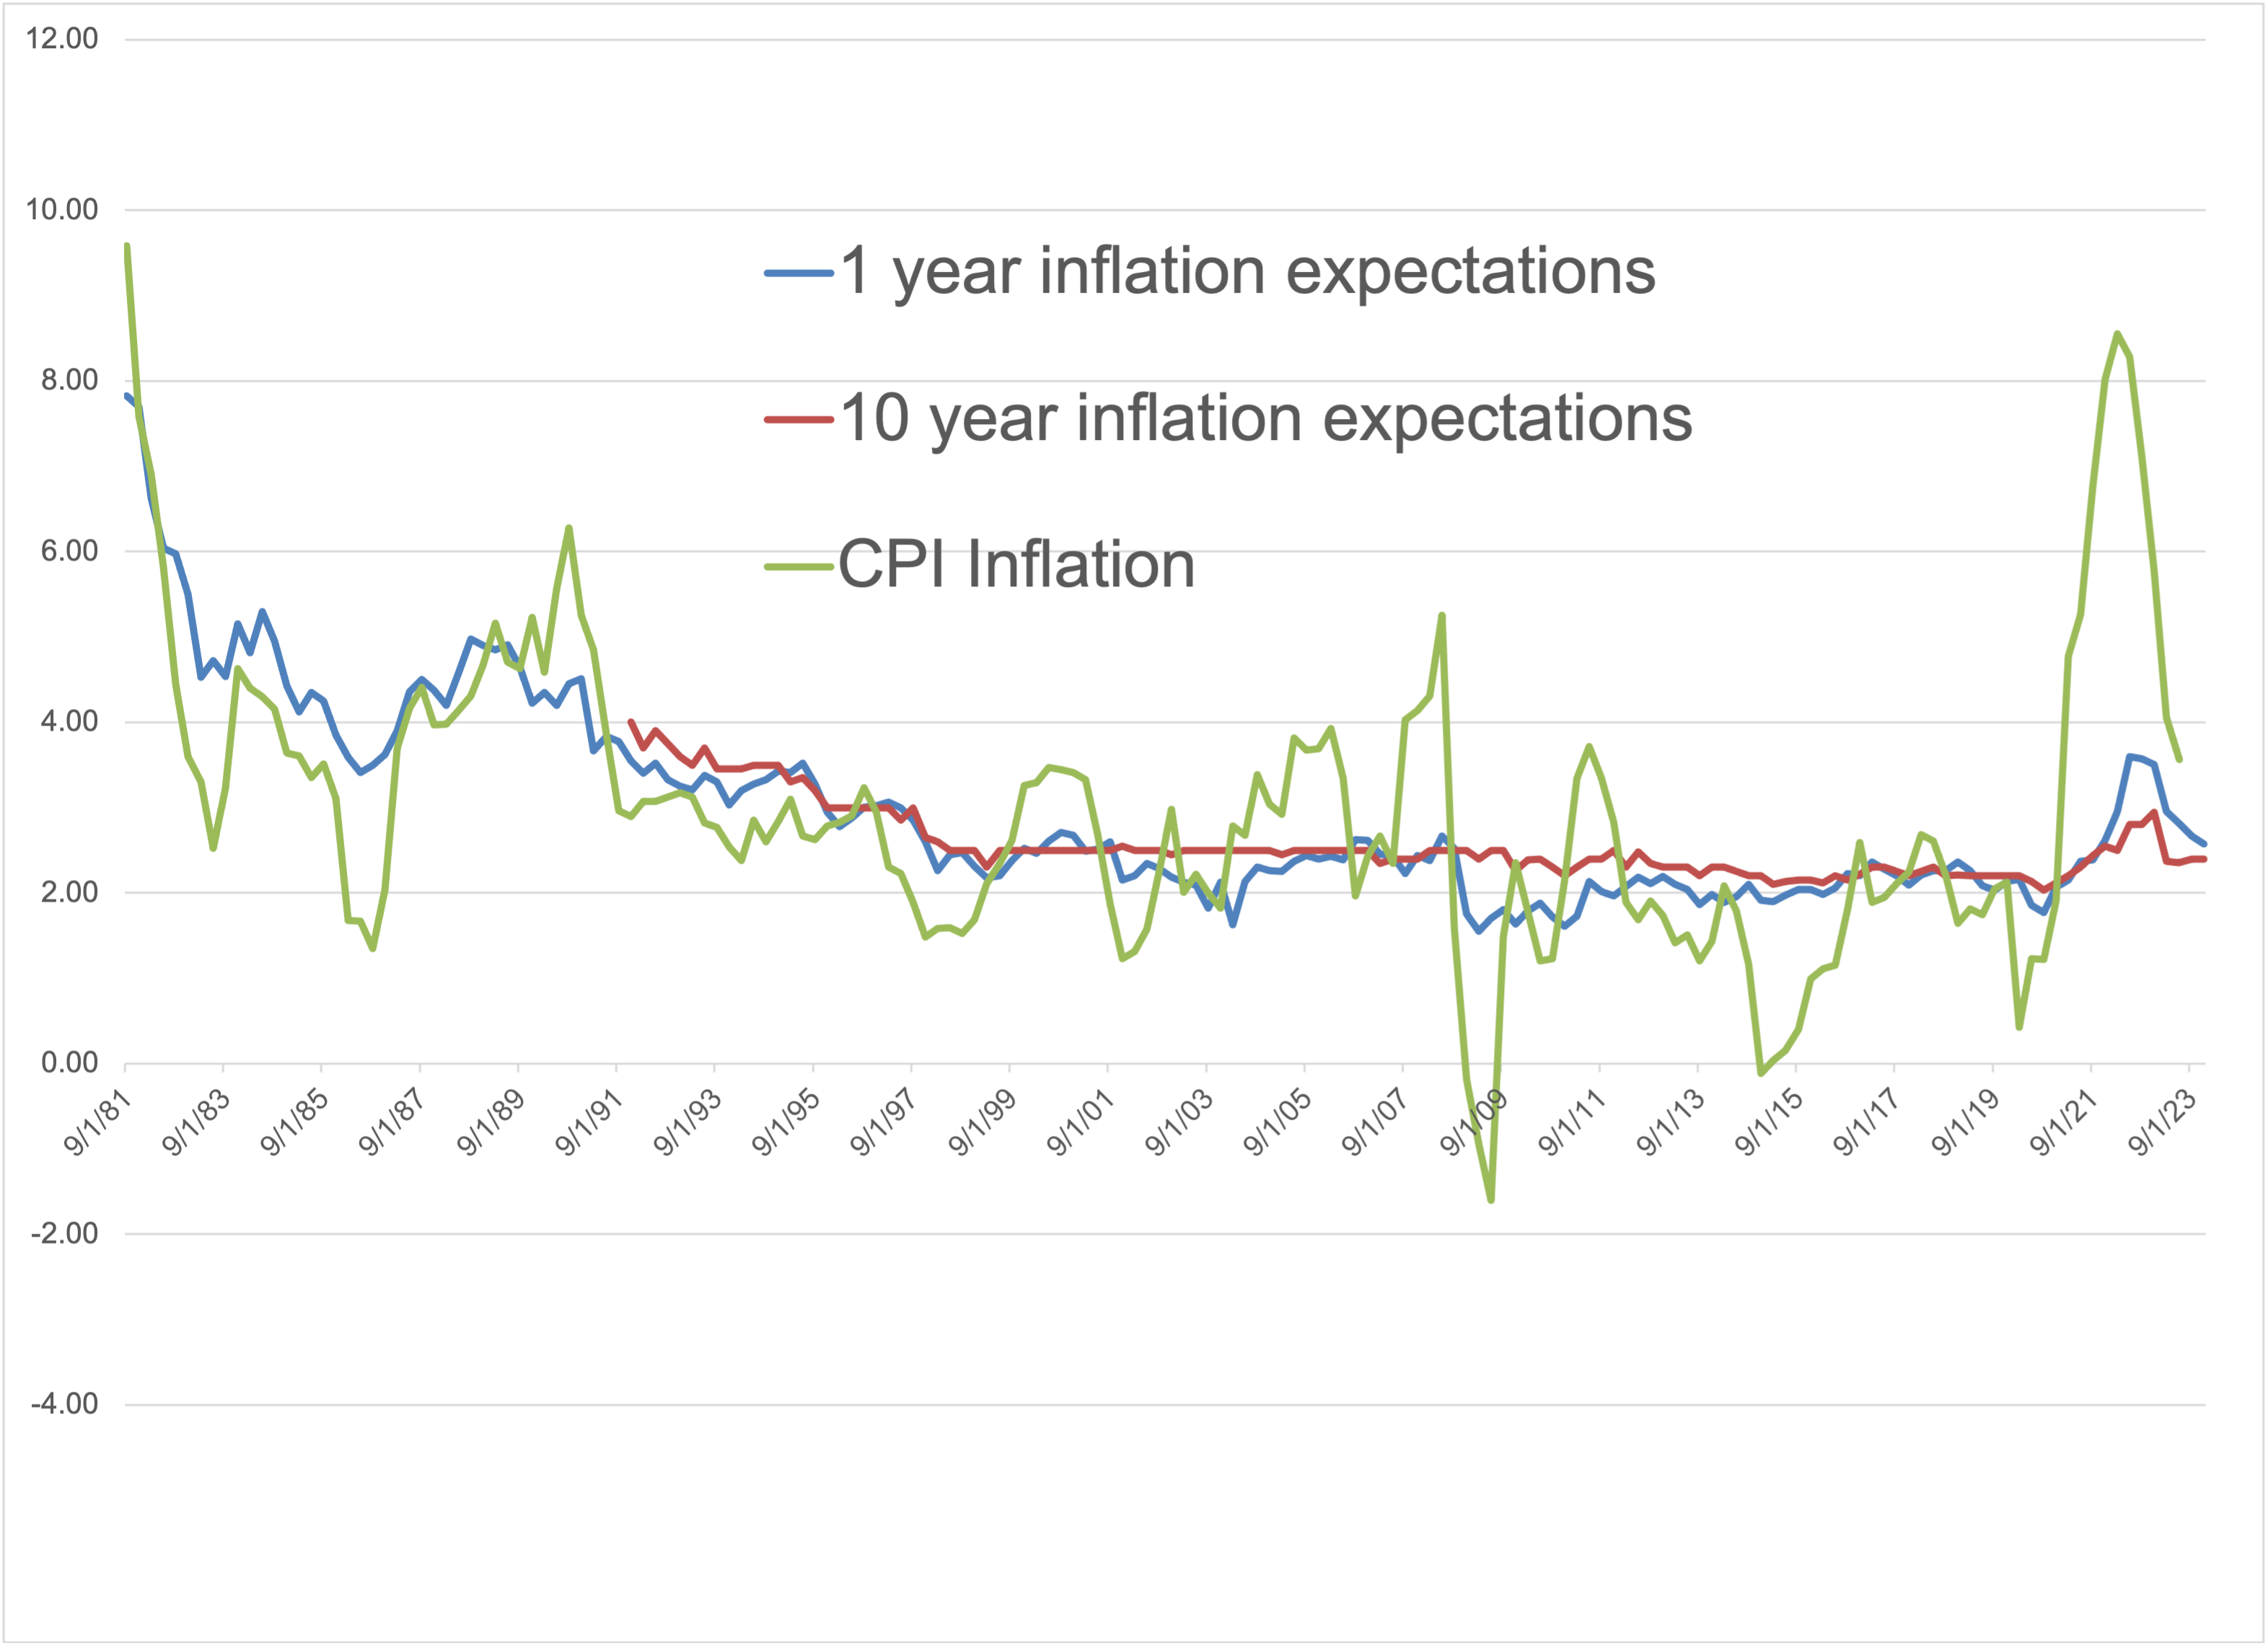
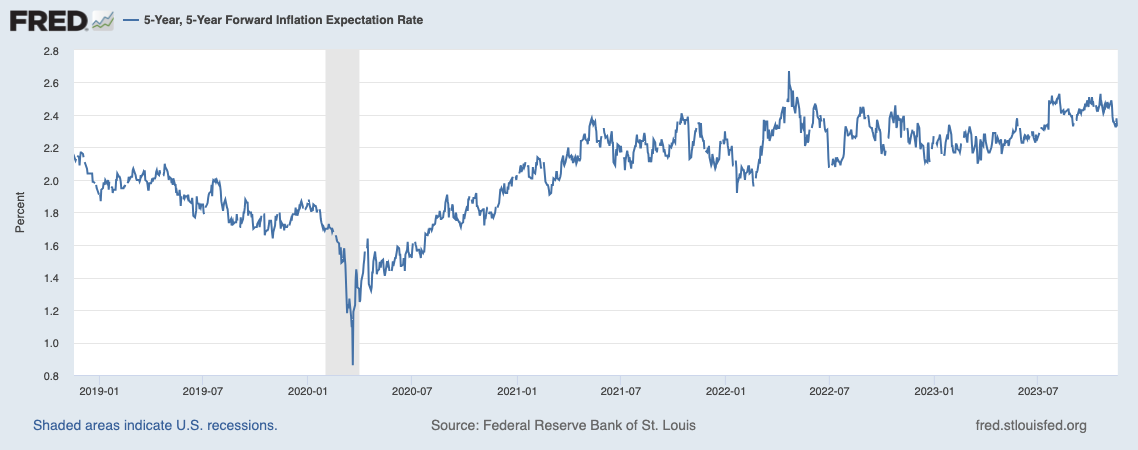
Three methods to measure expectations:
- surveys of consumers
- surveys and forecasts of economnists
- financial markets
Houeshold surveys
Professional surveys
Financial Markets
What are expectations based on?
Inflation expectations can be:
- adaptive
- anchored
- rational
- sticky
The Phillips Curve
Businesses May Face Excess Demand
A healthy economy increases the demand for goods and services.
When the quantity demanded at the prevailing price exceeds the quantity supplied, there is excess demand.
A short-run solution is increasing prices.
Demand and the output gap
Excess demand leads inflation to rise above inflation expectations.
Insufficient demand leads inflation to fall below inflation expectations.
When the economy is operating at full capacity, inflation equals inflation expectations.
The output gap measures the imbalance between output and productive capacity.
Demand-pull inflation
Demand-pull inflation is driven by the output gap. It leads inflation to diverge from inflation expectations
Phillips Curve and Unexpected Inflation
Unexpected inflation is the difference between inflation and inflation expectations.
The Philips curve illustrates the link between the output gap and unexpected inflation.
The output gap drives inflation to rise above or fall below inflation expectations.
The Phillips Curve - Step 1

The Phillips Curve - Step 2

The Phillips Curve - Step 3

Discover the Phillips Curve for the US - Step 1
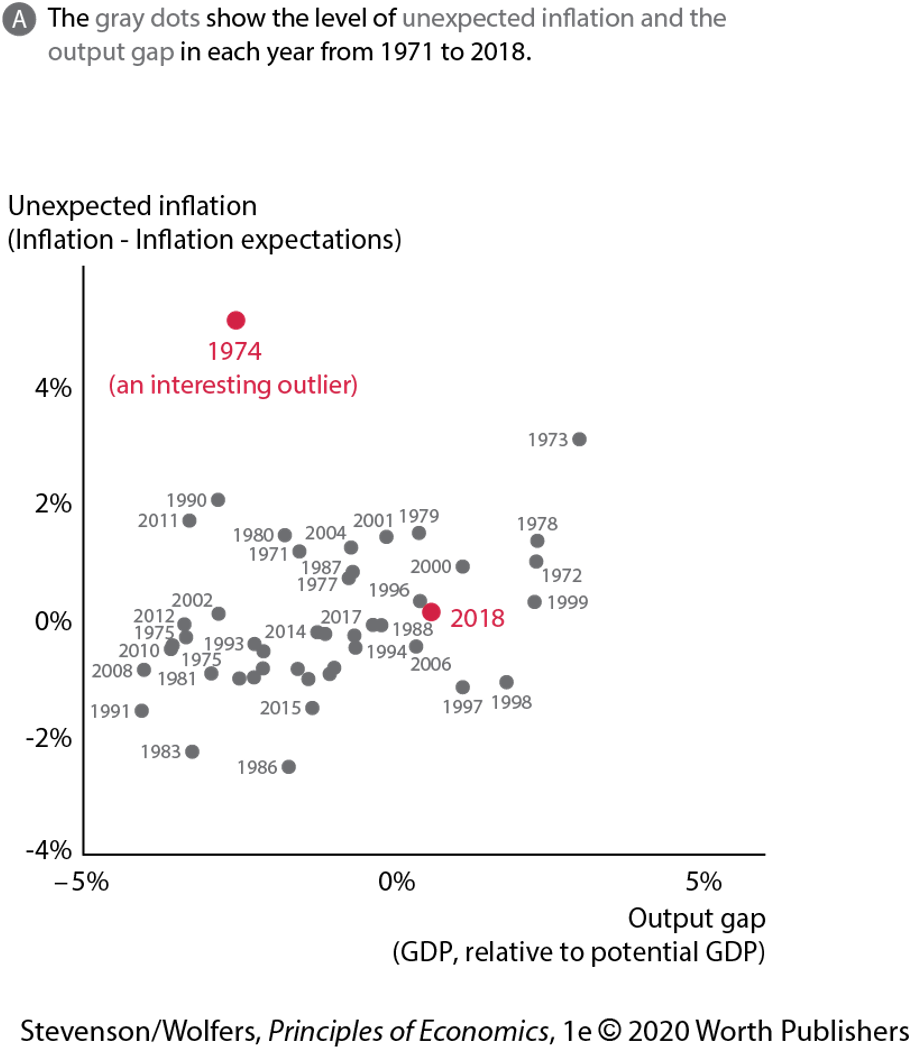
Discover the Phillips Curve for the US - Step 2
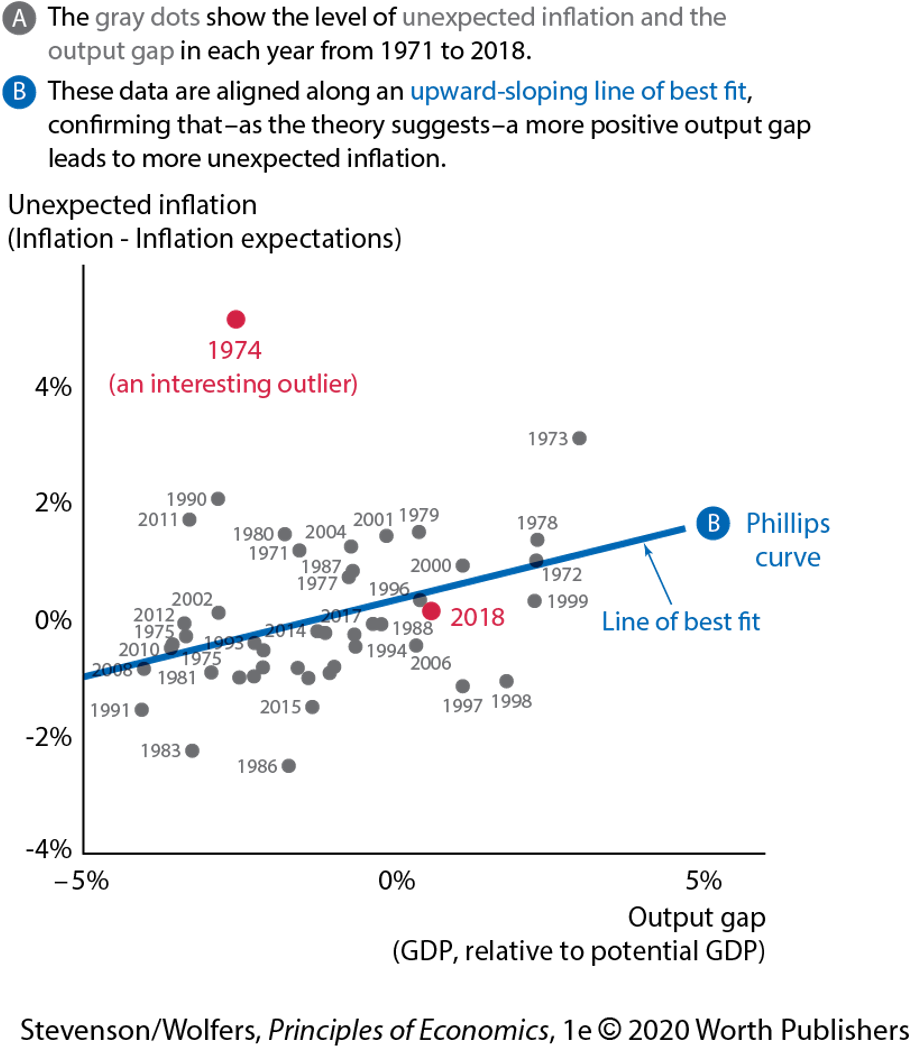
Phillips Curve and Forecasting
Investment banks, businesses, and government economists forecast inflation using estimates of the Phillips curve.
It is a two-step process:
- Assess inflation expectations.
- Forecast unexpected inflation.
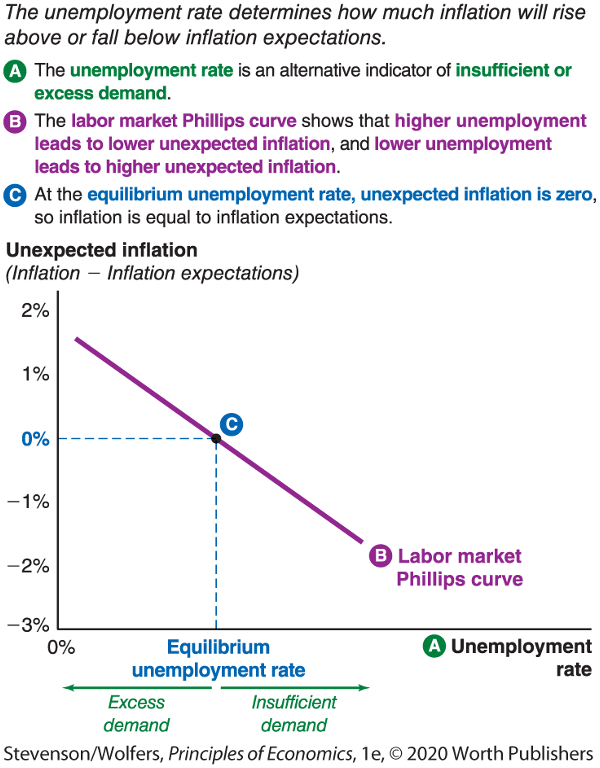
Labor Market Phillips Curve
- The labor market Phillips curve links unexpected inflation to the unemployment rate (rather than the output gap.)
↓Unemployment rate → ↑Unexpected inflation
- In this version, inflation is stable at the equilibrium unemployment rate.
Labor Market Phillips Curve
Supply Shocks and the Phillips Curve
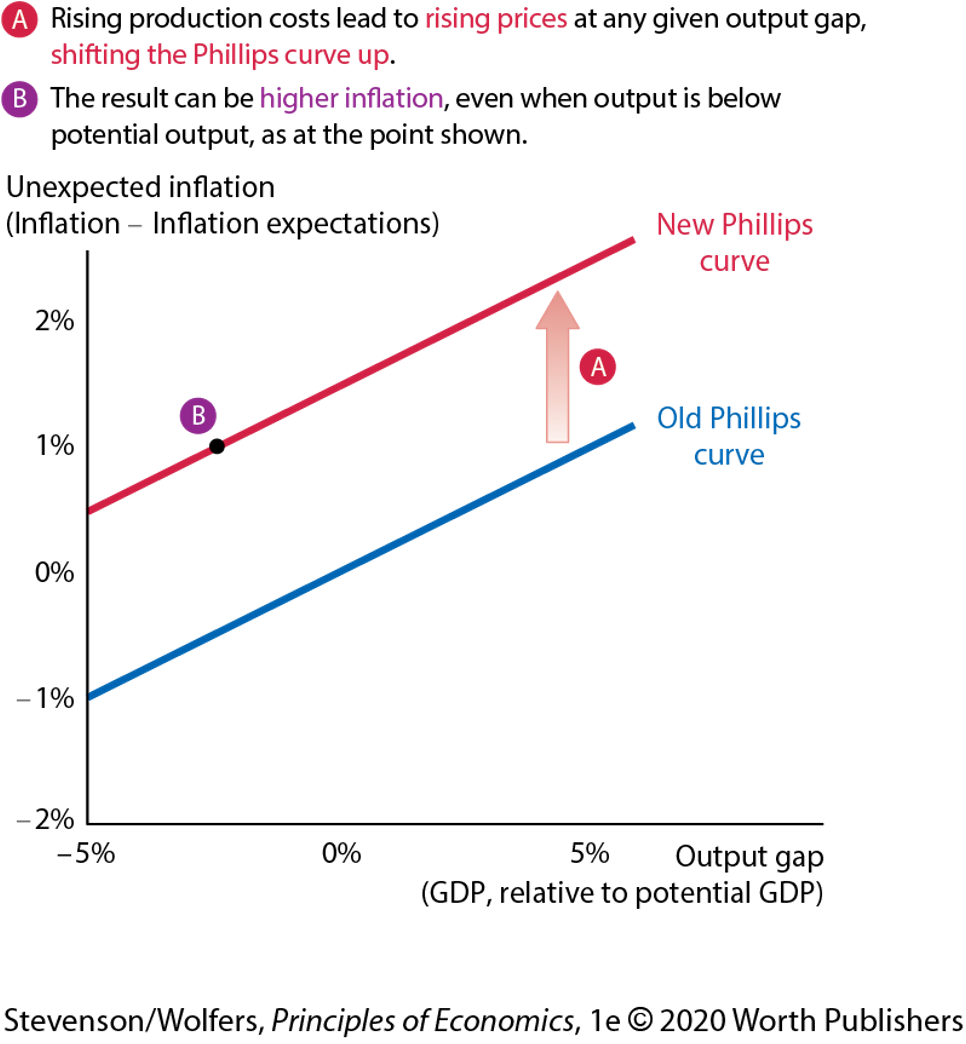
Unexpected boosts to production costs push sellers to raise their prices, resulting in cost-push inflation.
Cost-push inflation leads to more inflation at any given level of the output gap and for any given level of inflation expectations.
Rising Costs - Step 1
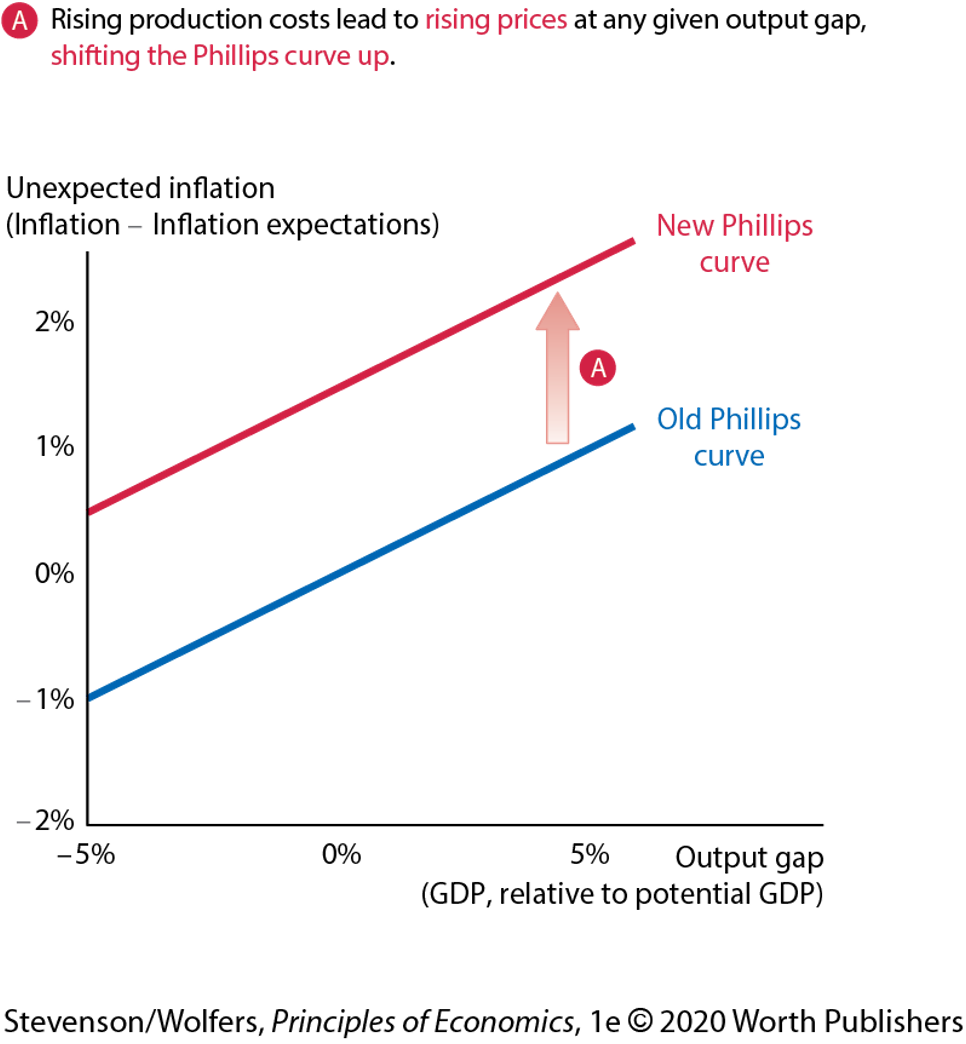
Rising Costs - Step 2
Supply Shocks
Any change in production costs that leads suppliers to change the prices they charge at any given level of output is called a supply shock.
Supply shocks shift the Phillips curve.
Phillips Curve Shifters
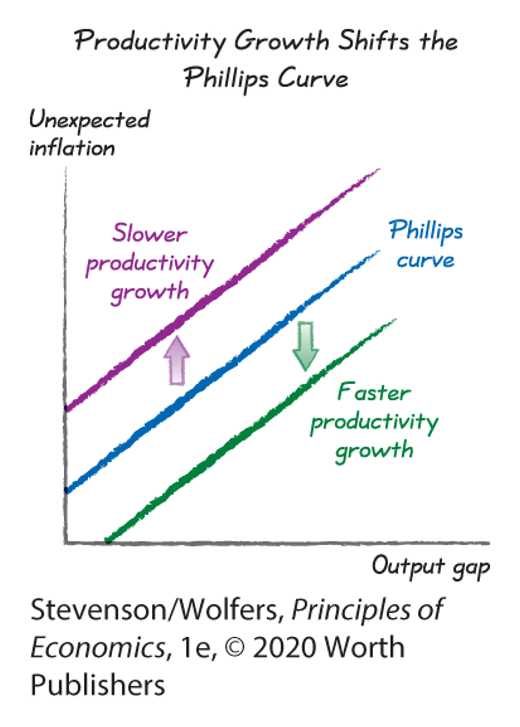
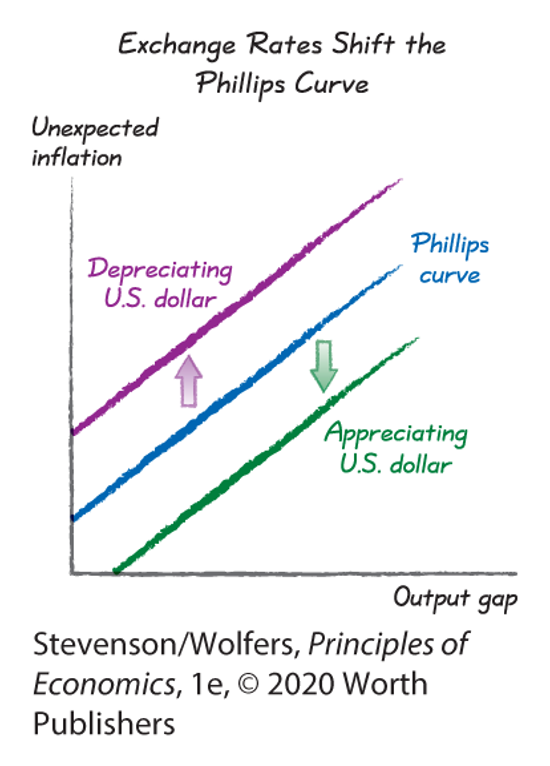
The Phillips curve shifts in response to unexpected changes in
- input prices.
- productivity.
- exchange rates.
Input Prices
- Oil and commodities: Increased oil prices lead to higher electric heating bills, gas prices, transportation prices, etc.
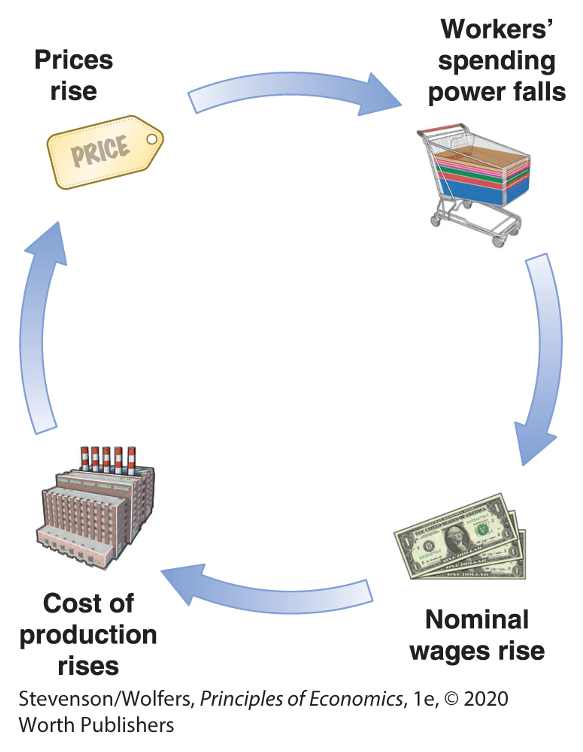
Wage-price spiral
Productivity
Exchange Rates
Movements along the Phillips curve

Shifts in the Phillips curve

Next time
To Do
Read “The Fed Model”
Do: Enjoy Thanksgiving!
Preview
